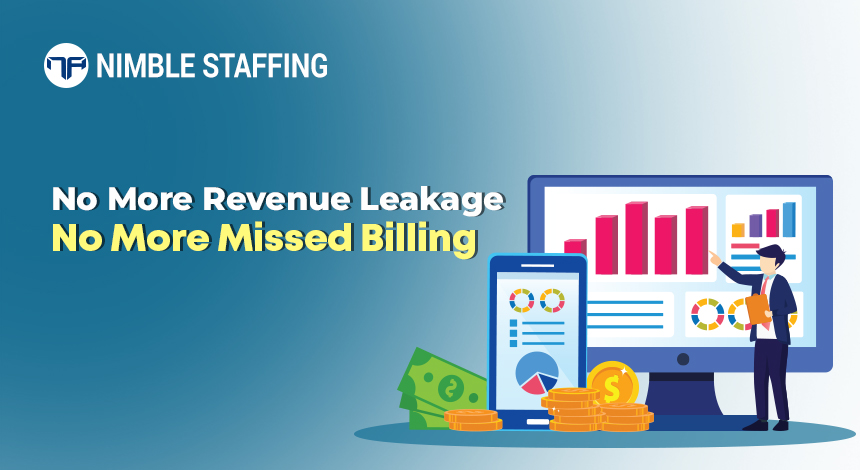

Dashboard is a visual treat for finance teams, who usually get troubled with mismanagement of bills, documents, time bound report generation and more. Nimble Staffing’s interactive dashboard gathers all the financials onto a single screen, where entire financial workflow could be viewed.
Staffing firms can grow effortlessly with data-driven insights. Manage revenue effectively with minimum losses and detect anomalies in the system wherever necessary instantly.
Pay rates outpace bill rates. Employer expenses are underestimated. Invoices remain unpaid for weeks. Billable hours are unrecorded. An end-of-month statement or sales report doesn’t usually make any of this clear.
The issue is resolved by implementing a profitability dashboard. It compiles financial and operational data in one place, allowing your finance team to understand where money is produced, where it leaks, and what needs to be addressed before the books shut.
What Is a Staffing Profitability Dashboard?
It is a reporting view that consolidates financial and operational data to show how the business is performing. Depending on how your firm is organized, you can slice results by:
- Client account
- Consultant
- Project, job order, or assignment
- Business unit or office
- Service type, such as temporary or contract
- fiscal year, week, month or quarter
Displaying data is the easy part. Each metric should point to a decision. A falling gross margin sends you to bill rates, pay rates, employment costs, and contract terms. Growing past-due receivables push collections up the priority list. A dashboard earns its place through the actions it triggers, not the numbers it shows.
The 10 Key Metrics for a Staffing Profitability Dashboard
| KPI | What It Measures | Review Frequency |
|---|---|---|
|
Revenue Growth |
Total income by client, service line, consultant, business unit |
Monthly |
|
Gross Profit & Margin |
Revenue minus direct costs; margin as a percentage |
Weekly / Monthly |
|
Client Gross Margin |
Per-account revenue, direct costs, GP, and margin % |
Monthly |
|
Consultant Profitability |
Billable hours, bill rate, pay rate, employment costs, GP per consultant |
Weekly |
|
Billable Utilization |
Billable hours as a % of available working hours |
Weekly |
|
Billed vs. Unbilled Revenue |
Authorized but uninvoiced amount of work, age, and reason |
Weekly |
|
Days Sales Outstanding (DSO) |
Average time from invoice to cash |
Weekly / Monthly |
|
Receivables Aging |
Outstanding invoices grouped by age |
Weekly |
|
Cash Flow & Payroll Funding |
Cash on hand, payroll due, expected collections, funding gap |
Daily / Weekly |
|
Operating Costs vs. Budget |
Overhead against plan and its effect on operating profit |
Monthly |
Each Metric Explained
-
- Increase in Revenue
Monitor revenue by client, service division, consultant, and business unit. Separate regular contract revenue from one-time project work and compare results to budget and previous quarters.
Reasons for its significance: A declining client account or an underperforming business unit may be concealed by an overall increase in revenue. The specifics that finance must address are concealed by blended totals.
- Gross Profit and Gross Margin
The direct costs that your organization includes in its cost of sales are subtracted from revenue to determine gross profit. For temporary and contract employment, direct costs typically consist of consultant pay, payroll taxes, benefits, and workers’ compensation.
Gross profit equals revenue minus direct costs. For contract staffing, direct costs typically encompass consultant compensation, payroll taxes, benefits, and workers’ compensation.
Formula: Gross Margin (%) = (Revenue − Direct Costs) ÷ Revenue × 100
Example: A staffing firm earns $100,000 in revenue with $78,000 in direct costs.
Gross profit = $22,000. Gross margin = 22%.
The dashboard should compare this margin to budget, prior periods, contract targets, and relevant service-line benchmarks.
3. Gross Margin of Clients
Blended margins can obscure substantial disparities at the client level. An account producing $200,000 monthly with a 15% margin might provide greater total profit than another earning $80,000 at a 30% margin, albeit the latter outperforms on a percentage basis.
Revenue, direct costs, gross profit, and margin percentage for each material client should be displayed on the dashboard. Flag rate changes or cost increases at the contract level whenever feasible. Management measures include examining low-margin contracts, addressing billing concerns, renegotiating prices, and determining whether new service scope requires an update on terms
4. Consultant-Level Profitability
The financial performance of a single assignment may fluctuate dramatically from the client account average. Monitor the billable hours, bill rate, pay rate, direct employment costs, gross profit, and gross margin of each active consultant.
This identifies assignments that have been impacted by underutilization, unplanned overtime, unapproved rate changes, or incorrect cost assumptions. For instance, a consultant charging more overtime than expected might boost revenue but diminish profit margins if the client agreement lacks an overtime premium to offset the extra employer expenses.
5. Billable Utilization
Formula: Utilization (%) = Billable Hours ÷ Available Work Hours × 100
Define the denominator clearly: do ‘available hours’ include training time, paid leave, holidays, and non-billable client work? Apply the definition consistently.
Firms that manage bench time, work on projects with variable duties, or transport consultants between assignments are particularly dependent on utilization. Monitor assignments by assignment type, business unit, role, and client.
6. Revenue: Billed vs. Unbilled
The unbilled revenue is the amount of work that has been completed but has not yet been invoiced. Missing timesheets, overdue client approvals, improper purchase order references, and incomplete billing records are among the most common reasons. Authorized but unvoiced hours estimated unbilled revenue, the age of each unbilled item, and the reason for its continued existence should be displayed on the dashboard.
Management action: Generate an exception queue and assign each material unbilled item to an owner with a resolution date.
7. Days Sales Outstanding (DSO)
Formula: DSO = Average Accounts Receivable ÷ (Credit Sales ÷ Days in Period)
Apply this on a consistent sales base and reporting period. Do not compare DSO figures calculated on different bases.
In staffing, DSO is particularly important because payroll and consultant costs are paid before client invoices are collected. A high or rising DSO increases working capital requirements even when the business is profitable. Track DSO per client alongside payment terms, invoice dispute history, and aging. Note that changes in sales volume, seasonality, and client mix can all affect DSO interpretation in context.
8. Receivables Aging
While DSO gives an overall measure, the aging report shows where collection risk is concentrated. Group receivables by:
- Current (within terms)
- 1–30 days past due
- 31–60 days past due
- 61–90 days past due
- Over 90 days have passed due
Use consistent aging criteria and distinguish between days from invoice date and days past payment terms. Management action: priorities large past-due balances, investigate disputes, confirm invoice delivery, and escalate clients with chronic payment delays.
9. Cash Flow and Payroll Funding
A profitable staffing firm can still experience a cash shortfall if consultant payroll must be funded before client invoices are collected. The dashboard should include cash balances, payroll obligations due, expected collections, accounts payable, any credit facilities, and a rolling short-term cash forecast.
A useful supplementary metric is the payroll funding gap the amount of consultant payroll and associated outflows that must be paid before the corresponding client cash arrives. Tracking this overtime shows whether working capital demand is growing as the business scales.
10. Operating Costs and Operating Profit
Gross margin is not the bottom line. Recruiter salaries and commissions, sales costs, technology, office expenses, insurance, and other overheads all reduce gross profit to arrive at operating profit.
Track operating costs against budget each period. Compare operating expenses as a percentage of revenue to prior periods and to plan. This shows how much of each margin dollar is being consumed by overhead and what is left as operating profit.
Ensure terminology is consistent between your management accounts and your formal financial statements to avoid confusion when the two sets of numbers are compared.
How Often Should Each Metric Be Reviewed?
| Frequency | What to Review |
|---|---|
|
Daily |
Cash position, urgent billing exceptions, payroll funding shortfalls, critical collection threats |
|
Weekly |
Consultant profitability exceptions, utilization rates, unbilled revenue, receivables aging, upcoming payroll funding requirements |
|
Monthly |
Gross margin trends, operating expenses vs. budget, client profitability, forecast variance |
|
Quarterly |
Service-line profitability, pricing strategy review, client concentration risk, long-term financial planning |
The right cadence depends on the firm’s size, transaction volume, client payment terms, and reporting maturity. These are starting points adapt them to what is operationally useful for your business.
Common Dashboard Pitfalls and How to Avoid Them
Too Many KPIs
A dashboard with dozens of metrics makes it hard to spot what needs attention. Start with metrics that directly affect cash, margin, and risk. Add more only when there is a clear decision they support.
Inconsistent Definitions
Finance and operations may calculate gross margin, utilization, and DSO differently. Agree on definitions across teams, document them, and assign ownership for enforcing consistency.
Stale Data
A sophisticated dashboard built on data that is several weeks old has limited operational value. Automate data flows where possible and displays the reporting period and last-refresh time on every dashboard view.
Backward-Looking Only
Historical data is important but insufficient. Combine lagging indicators with leading ones pending contract renewals, open unbilled hours, current utilization trends, and expected collection timing so management can act before a problem appears in the month-end numbers.
No Ownership of Exceptions
Every material exception should have an assigned owner, a next step, and a target date. Reporting without accountability does not improve profitability.
How Nimble Staffing Supports Profitability Reporting
Nimble Accounting’s platform connects consultant records, timesheets, invoices, payroll, commissions, and financial reporting into a single integrated workflow. Its dashboard layer includes business summaries, bank balances, accounts receivable and payable, consultant-level revenue, billed vs. unbilled data, and aggregated views across business units and profit centers.
Because all this sits within the same platform rather than being pulled from separate systems finance teams can move from a high-level margin summary to a consultant-level drill-down without switching tools or reconciling reports manually.
Ask the Nimble staffing team to walk through how the reporting features map to your specific firm structure, including how results are segmented by client, consultant, service type, and business unit.
Get a Clearer Picture of Your Firm’s Financial Performance
Revenue tells you how busy you are. A profitability dashboard tells you how well that activity converts into margin and cash.
Nimble staffing connects timesheets, invoicing, payroll, commissions, and financial reporting
so your finance team has the visibility to act, not just report.
Visit nimblestaffing.net to learn more.
Frequently Asked Questions
What information should a staffing profitability dashboard offer at a minimum?
Minimum requirements include revenue, gross profit, and gross margin (total and by client), consultant-level profitability, billable utilization, billed versus unbilled revenue, accounts receivable aging, DSO, cash position, and operating costs versus budget. The following ten metrics provide finance teams with a comprehensive understanding of margin, billing quality, collections, and cash.
What is an appropriate gross margin for a staffing firm?
There is no universal benchmark that is applicable to all organizations. Depending on the staffing vertically, contract structure, employment cost model, service balance, and definition of direct costs, margins can vary significantly. Please compare your results to your own historical performance and to relevant segment benchmarks for your service type, rather than to blended industry averages.
What is the significance of DSO for staffing companies?
In general, staffing firms compensate consultants prior to collecting payments from clients. If the business is funding a growing gap between outflows and inflows, it is indicative of a high or increasing DSO. Even a prosperous company may suffer a cash problem if DSO is extended. By monitoring DSO per client, as well as aging and payment terms, finance teams can be proactive in addressing this gap.
Is it possible for a dashboard to identify clients that are not profitable?
If the underlying data includes client-level revenue and direct costs, the dashboard can calculate gross profit and margin per account. Yes. Consistent direct cost allocation and the explicit treatment of any shared overhead are essential for accuracy. As part of its standard reporting package, Nimble Accounting discloses client-level profitability.
How can staffing firms effectively automate their financial reporting?
Through the integration of timesheets, billing, payroll, accounting, and collections into a single platform. Harmonizing metric definitions throughout teams and creating a unified reporting framework eradicates superfluous data input and manual reconciliation. Nimble Accounting is designed to specifically facilitate this integration for IT staffing operations in the United States.