Quick Answer: Staffing margin forecasting projects future revenue, direct costs, and profit using bill rates, pay rates, billable hours, utilization, and employer costs. CFOs improve accuracy by using current contract data, modeling bench time, tracking margin by client and consultant, and updating forecasts whenever conditions change.
Revenue growth does not always mean higher profitability. Rising consultant pay rates, overtime, unbilled bench time, and declining utilization can reduce margins even when revenue holds steady.
These challenges grow when a firm manages multiple clients, consultants, branches, and contracts. By connecting financial and operational data, finance teams can see which clients and assignments generate profit, and where margin may erode before it shows up in results.
What Is Staffing Margin Forecasting?
Staffing margin forecasting is the process of projecting future revenue, direct costs, and profit margins using financial and operational data. Unlike revenue forecasting alone, it accounts for the costs required to deliver staffing services.
A staffing margin forecast typically includes:
- Client bill rates and consultant pay rates
- Expected billable hours and overtime
- Consultant utilization and bench time
- Benefits, payroll taxes, and employer costs
- Client contracts and engagement expenses
- Commissions and pipeline assignments
The objective is to estimate future profitability and spot margin changes before they affect actual results.
Why Is Margin Forecasting Important for Staffing Firms?
Staffing firms balance client pricing, consultant pay, utilization, and operating costs. Small changes in any of these can significantly affect profit. Effective margin forecasting helps CFOs:
- Improve budget accuracy using current financial data
- Identify margin pressure before month-end reporting
- Plan around expected client demand
- Understand the impact of rate changes and overtime
- Improve cash flow planning by watching receivables alongside profitability
A reliable forecast answers three questions: How much revenue will the firm generate? What will it cost to generate it? Which clients and consultants will contribute the most profit?
10 Data Inputs Staffing CFOs Need for Accurate Forecasting
Accurate forecasts depend on current, reliable inputs.
- Client Bill Rates
Use contractual rates and agreed pricing changes rather than outdated historical averages.
- Consultant Pay Rates
If pay rises while bill rates stay flat, the bill-to-pay spread narrows and gross margin declines, even when revenue is unchanged. Tracking pay rate changes helps CFOs identify margin pressure early and adjust forecasts accordingly.
- Billable Hours
Forecast realistic hours based on assignments and expected demand, not maximum capacity.
- Overtime
Overtime raises labor costs, especially when clients do not reimburse the full premium. Include expected overtime hours and the billing rules that apply.
- Benefits and Employer Burden
Benefits, employer payroll taxes, and insurance are part of the real cost of delivery. Pay rate alone is not the full cost, and leaving burden out overstates profitability.
- Engagement Expenses
Equipment, travel, and subcontractor charges affect client and consultant profitability. Include them to see the true performance of each engagement.
- Commission Expenses
Sales commissions affect contribution margin. Counting them alongside direct labor gives a more complete view of assignment profitability.
- Client Contract Terms
Contracts define bill rates, payment terms, overtime rules, minimum hours, and pricing adjustments. Reflect client-specific terms instead of applying one assumption to every account.
- Pipeline Assignments
Pipeline work influences future revenue but is not guaranteed. Weight it by probability, start date, assignment length, and expected hours.
- Consultant Utilization
Utilization is the share of available consultant capacity that produces billable work. When it falls, revenue drops while many costs continue, so model bench time to avoid overstating profit. The example below shows how quickly this happens. For more details, read our blog to bench cost.
How to Calculate Staffing Margin: A Worked Example
Gross margin compares revenue with direct costs.
Gross margin (%) = (Revenue − Direct costs) ÷ Revenue × 100
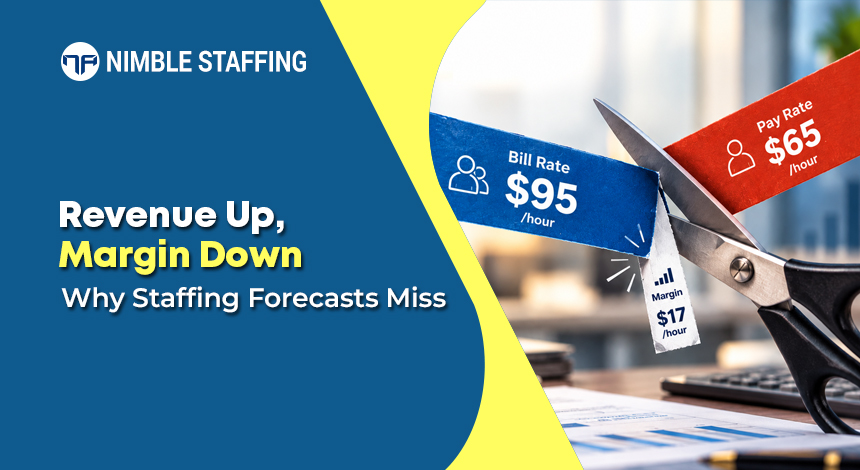
Take a consultant with these monthly economics:
| Metric | Value |
|---|---|
|
Client bill rate |
$95/hour |
|
Consultant pay rate |
$65/hour |
|
Employer burden |
20% of pay ($13/hour) |
|
Total direct cost |
$78/hour |
|
Expected billable hours |
160 |
At full utilization:
- Revenue: 160 × $95 = $15,200
- Direct costs: 160 × $78 = $12,480
- Gross profit: $15,200 − $12,480 = $2,720
- Gross margin: $2,720 ÷ $15,200 × 100 = about 17.9%
Now assume one week on the bench, so the consultant bills 120 hours while the firm still pays for 160:
- Revenue: 120 × $95 = $11,400
- Direct costs: 160 × $78 = $12,480
- Gross result: $11,400 − $12,480 = −$1,080
One unbilled week turns a profitable assignment into a loss. Across hundreds of consultants, ignoring utilization can badly distort a forecast.
Six Ways CFOs Can Improve Margin Forecast Accuracy
- Use Current Financial Data
Base forecasts on current rates, assignments, hours, expenses, and contracts. Outdated inputs produce projections that look precise but no longer match the business.
- Compare Forecasts With Actual Results
Review projected and actual revenue, costs, gross margin, and utilization regularly. Investigate each variance to learn whether it came from rate changes, overtime, bench time, or shifting demand.
- Monitor Client-Level Margins
Company-wide averages can hide unprofitable accounts. A client with flat bill rates and rising pay costs may look fine today and thin out next quarter. Pair this with the financial visibility practices that show profit by account.
- Track Profitability by Consultant
Consultants at the same client can have different pay rates, hours, and overtime patterns. Consultant-level reporting shows where margin is improving or slipping.
- Review Branch and Entity Performance
Firms with multiple branches or legal entities should compare revenue, costs, and profit at each level. Consolidated reporting shows which parts of the business are on track.
- Update Forecasts When Conditions Change
Consultant departures, pay increases, contract renegotiations, and utilization shifts can change profitability fast. Update when material changes occur instead of relying on quarterly reviews.
Common Staffing Margin Forecasting Mistakes
- Using average rates: Averages hide the clients and roles dragging margin down.
- Ignoring bench time: Paid but unbilled hours are cost with no matching revenue.
- Leaving out employer burden: Pay rate alone is not the full cost of delivery.
- Missing pay rate changes: Increases left out of the forecast become surprises at close.
Staffing Margin Metrics CFOs Should Track
Monitor these KPIs together to understand profitability:
- Gross margin percentage: The share of revenue left after direct costs.
- Bill-to-pay spread: The difference between the client bill rate and consultant pay rate.
- Consultant utilization: The share of available capacity generating billable work.
- Revenue per consultant: Revenue generated per consultant over a set period.
- Client profitability: Each client’s profit contribution after relevant costs.
- Contribution margin: Profit after variable costs, including commissions.
- Forecast-versus-actual variance: The gap between projected and actual performance.
- AR and DSO: Outstanding receivables and days sales outstanding, which show collection timing.
Read these metrics as a set. Revenue can rise while gross margin falls, and better utilization may not fully offset rising labor costs.
How Automation Improves Staffing Margin Forecasting
Spreadsheet forecasting gets harder as firms add consultants, clients, branches, and contracts. Manual collection and reconciliation delay reporting and introduce inconsistencies. A staffing accounting platform centralizes billing, cost, and expense data, so finance teams spend less time reconciling and more time acting on the numbers. Forecast accuracy still depends on reliable inputs, realistic assumptions, and regular reviews
Spreadsheet Forecasting vs. Nimble Staffing
Here is how the margin forecasting process changes when financial and operational data are centralized in a purpose-built staffing platform:
| Forecasting Area | Spreadsheet-Based | Nimble Staffing |
|---|---|---|
|
Data freshness |
Last month’s close |
Real-time, continuously updated |
|
Client margin view |
Manual by account |
Automated, by client and contract |
|
Consultant margin view |
Rarely tracked individually |
Per-consultant P&L built in |
|
Utilization tracking |
Manual calculation |
Live utilization dashboard |
|
Variance analysis |
Hours of reconciliation |
Consolidated, rapid comparison |
|
Branch / entity view |
Separate spreadsheets per entity |
Multi-entity consolidated dashboard |
|
Forecast updates |
Weekly manual rebuild |
Updated as placements and rates change |
|
Audit trail |
Version-controlled files at best |
Full automated transaction log |
Staffing Margin Forecasting with Nimble Staffing
Nimble Staffing supports post-recruitment accounting and financial operations, giving finance teams visibility into billing, consultant costs, expenses, receivables, and profitability. Beyond the reporting above, it also offers:
- Automated timesheet follow-ups: Help teams collect the information needed for timely billing.
- Billing and invoice automation: Less manual work in invoice creation and delivery.
- AR reporting and follow-ups: A clearer view of outstanding invoices and collections.
- Commission tracking: Visibility into commission expenses that affect assignment profitability.
With accounting and operational data connected, finance teams can make better-informed decisions on client pricing, consultant utilization, and profitability.
Conclusion: Build More Reliable Staffing Margin Forecasts
Staffing margin forecasting requires more than estimating revenue. Bill rates, pay rates, billable hours, utilization, bench time, employer costs, commissions, and client contracts all shape profitability.
CFOs can improve accuracy by using current data, tracking client and consultant margins, comparing forecasts with actual results, and updating assumptions as conditions change.
Forecast with Confidence. Manage Margins with Clarity.
Build more reliable forecasts with visibility into client profitability, consultant costs, and assignment-level margins. Nimble Staffing connects staffing accounting, financial reporting, and operational data to help CFOs make informed decisions and manage margin pressure proactively.
Frequently Asked Questions
1. What is staffing margin forecasting?
It projects future revenue, direct costs, and profitability using bill rates, pay rates, billable hours, utilization, and other staffing expenses. It helps CFOs anticipate margin changes before they appear in actual results.
2. How do you calculate gross margin for a staffing firm?
Subtract direct costs from revenue to get gross profit, then divide by revenue and multiply by 100. Formula: Gross margin (%) = (Revenue − Direct costs) ÷ Revenue × 100.
3. What factors affect staffing firm profitability?
Client bill rates, consultant pay rates, billable hours, overtime, utilization, bench time, employer burden, commissions, engagement expenses, and client contract terms.
4. How often should staffing firms update margin forecasts?
At least monthly, and whenever a significant change occurs, such as a pay increase, contract renegotiation, or utilization shift.
5. How can technology improve staffing margin forecasting?
Staffing accounting platforms centralize financial data, automate reporting, and show profitability by client and consultant. This reduces manual reconciliation and helps finance teams forecast with more confidence.